Adventures in Profiling with Go

I spend a lot of my time working on my main pet project: lazygit. This year I’m hoping to get the app to a state worthy of the title Lazygit 1.0, but the last few problems are often the hardest to solve.
One problem I assumed would always be hard to solve has actually proven fairly easy, and that is the problem of high CPU usage. For as long as I can remember, lazygit has had a CPU usage that hasn’t quite felt proportionate to what was actually happening at runtime. I typically use lazygit by jumping in and out of the program whenever I need to, but other people use it in a dedicated terminal window and leave it on all day (or all week). So creeping CPU issues have long been a problem, and they’ve been a problem that I haven’t been very sensitive to thanks to how I use the program myself.
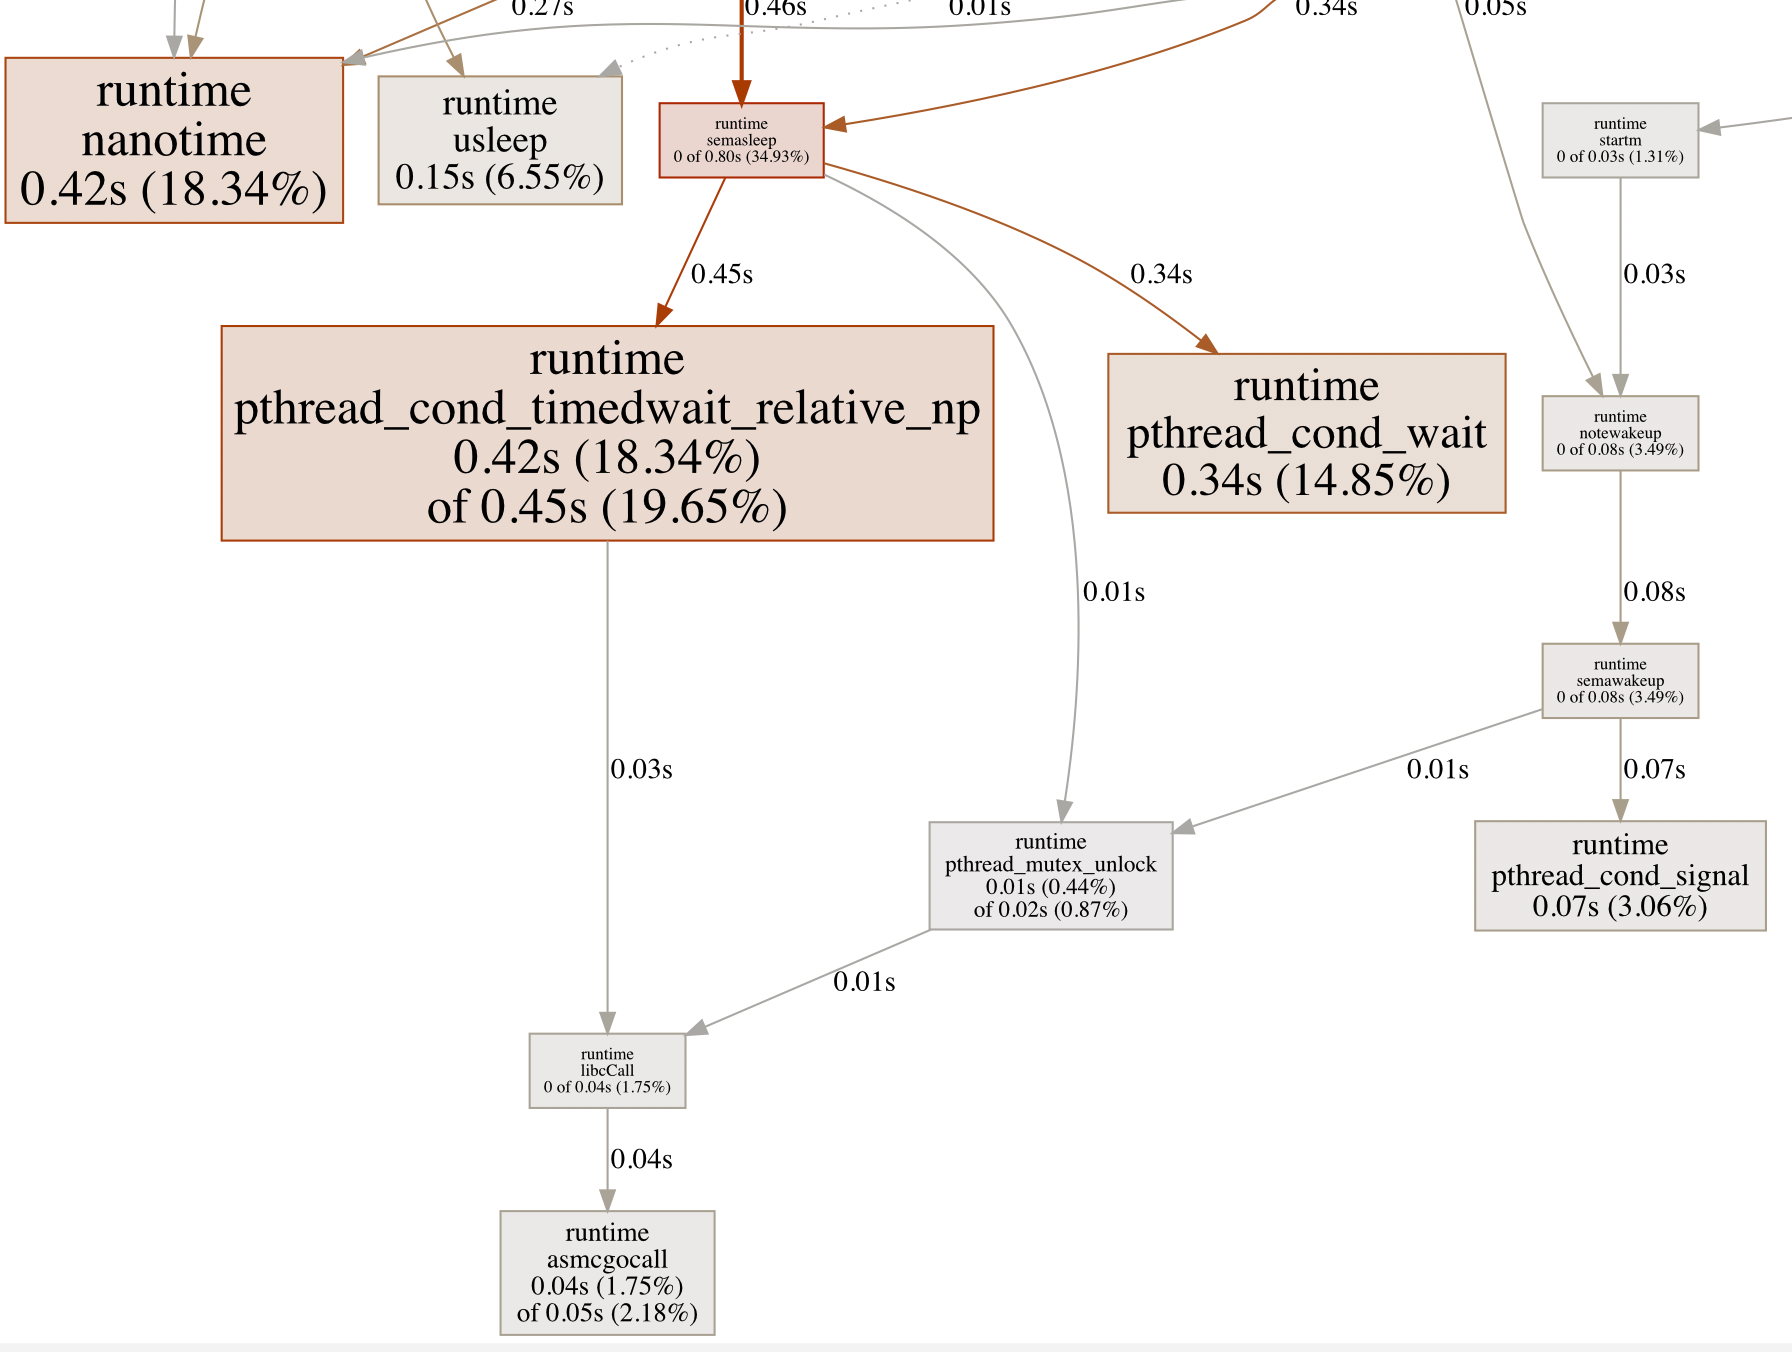
But I became much more sensitive to the problem when a recent sponsor of mine raised an issue about CPU issues caused by switching repos. When you’re working on an open source project for roughly 1 cent an hour, your sponsors matter! He was kind enough to provide a cpu profile output showing two main things: firstly that a lot of time was spent in my goEvery function, and that a lot of other time was spent by non-golang timer waiting processes like pthread_cond_timedwait_relative_up.
the goEvery function worked like this:
func (gui *Gui) goEvery(interval time.Duration, function func() error) {
	go func() {
		for range time.Tick(interval) {
			_ = function()
		}
	}()
}
It simply took an interval and some function to execute at the end of each interval. When we initialized the gui we would call goEvery for periodically refreshing the files panel after few seconds, and for checking whether to refresh the screen if a loader animation was present (which had a smaller interval).
The problem was that each time we switched repos, we would re-initialize the gui, meaning we would call goEvery again for each thing we wanted to setup periodically. The previous ones were in separate threads and would simply continue, meaning we’d be doubling up on work each time we switched repos.
for {
    // each time we call gui.Run we call goEvery some more
		if err := gui.Run(); err != nil {
                        ...
			if err == gocui.ErrQuit {
                                ...
				break
			} else if err == gui.Errors.ErrSwitchRepo {
				continue
                        ...
			} else {
				return err
			}
		}
	}
Two possible solutions came to mind: the first was to only call goEvery once at the start and never call it again. This is pretty reasonable, but I can imagine a situation where you’re in a new repo and now you need to pass in a different function to goEvery, so it could get hard to manage. Instead I opted to have a stop channel on the gui struct which I would close and reassign whenever I switched repos:
for {
    // each time we call gui.Run we call goEvery some more
		if err := gui.Run(); err != nil {
                        close(gui.stopChan)
                        ...
			if err == gocui.ErrQuit {
                        ...
				break
			} else if err == gui.Errors.ErrSwitchRepo {
				continue
                        ...
			} else {
				return err
			}
		}
	}
The goEvery function became:
func (gui *Gui) goEvery(interval time.Duration, stop chan struct{}, function func() error) {
	go func() {
		for {
			select {
			case <-time.Tick(interval):
				_ = function()
			case <-stop:
				return
			}
		}
	}()
}
I was confident that would fix the issue but I needed to no profile the code myself, so I looked up how to profile CPU in golang and came across the runtime/pprof package:
// in main.go
import "runtime/pprof"

func main() {
	f, err := os.Create("cpu.prof")
	if err != nil {
		log.Fatal("could not create CPU profile: ", err)
	}
	defer f.Close()
	if err := pprof.StartCPUProfile(f); err != nil {
		log.Fatal("could not start CPU profile: ", err)
	}
	defer pprof.StopCPUProfile()
	...
Here I’m just creating a file named ‘cpu.prof’ for the profiler to write to, and then starting profiling before doing anything else. To view the output graphically I needed to install graphvis via brew install graphvis and run go tool pprof -web cpu.prof.

I had solved the issue of CPU increasing from switching repos, but a new issue arose. A heap of time was being spent in this runtime pthread_cond_timedwait_relative_np function (which I believe was an OS-specific function and not something from go). Worse still, the CPU rate actually was climbing gradually, which had not been the case before my changes.
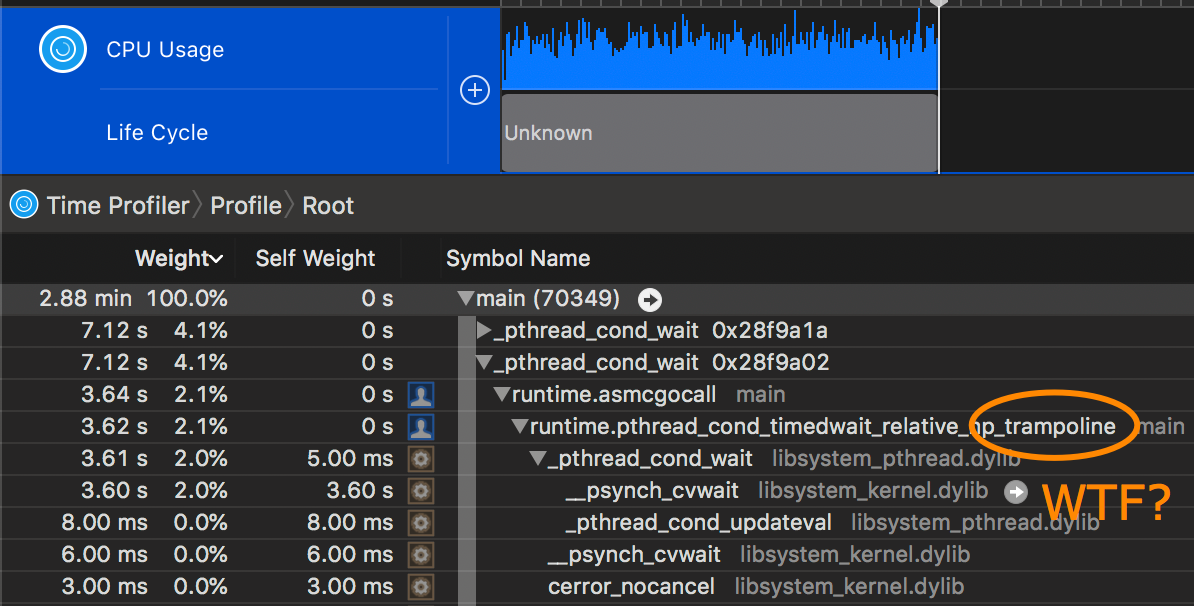
I wanted to know what part of my code was invoking that timedwait function (I had actually made several changes as part of the initial fix), but I couldn’t find a way for pprof to tell me where. I tried using the Instruments OSX app but it was equally unhelpful:

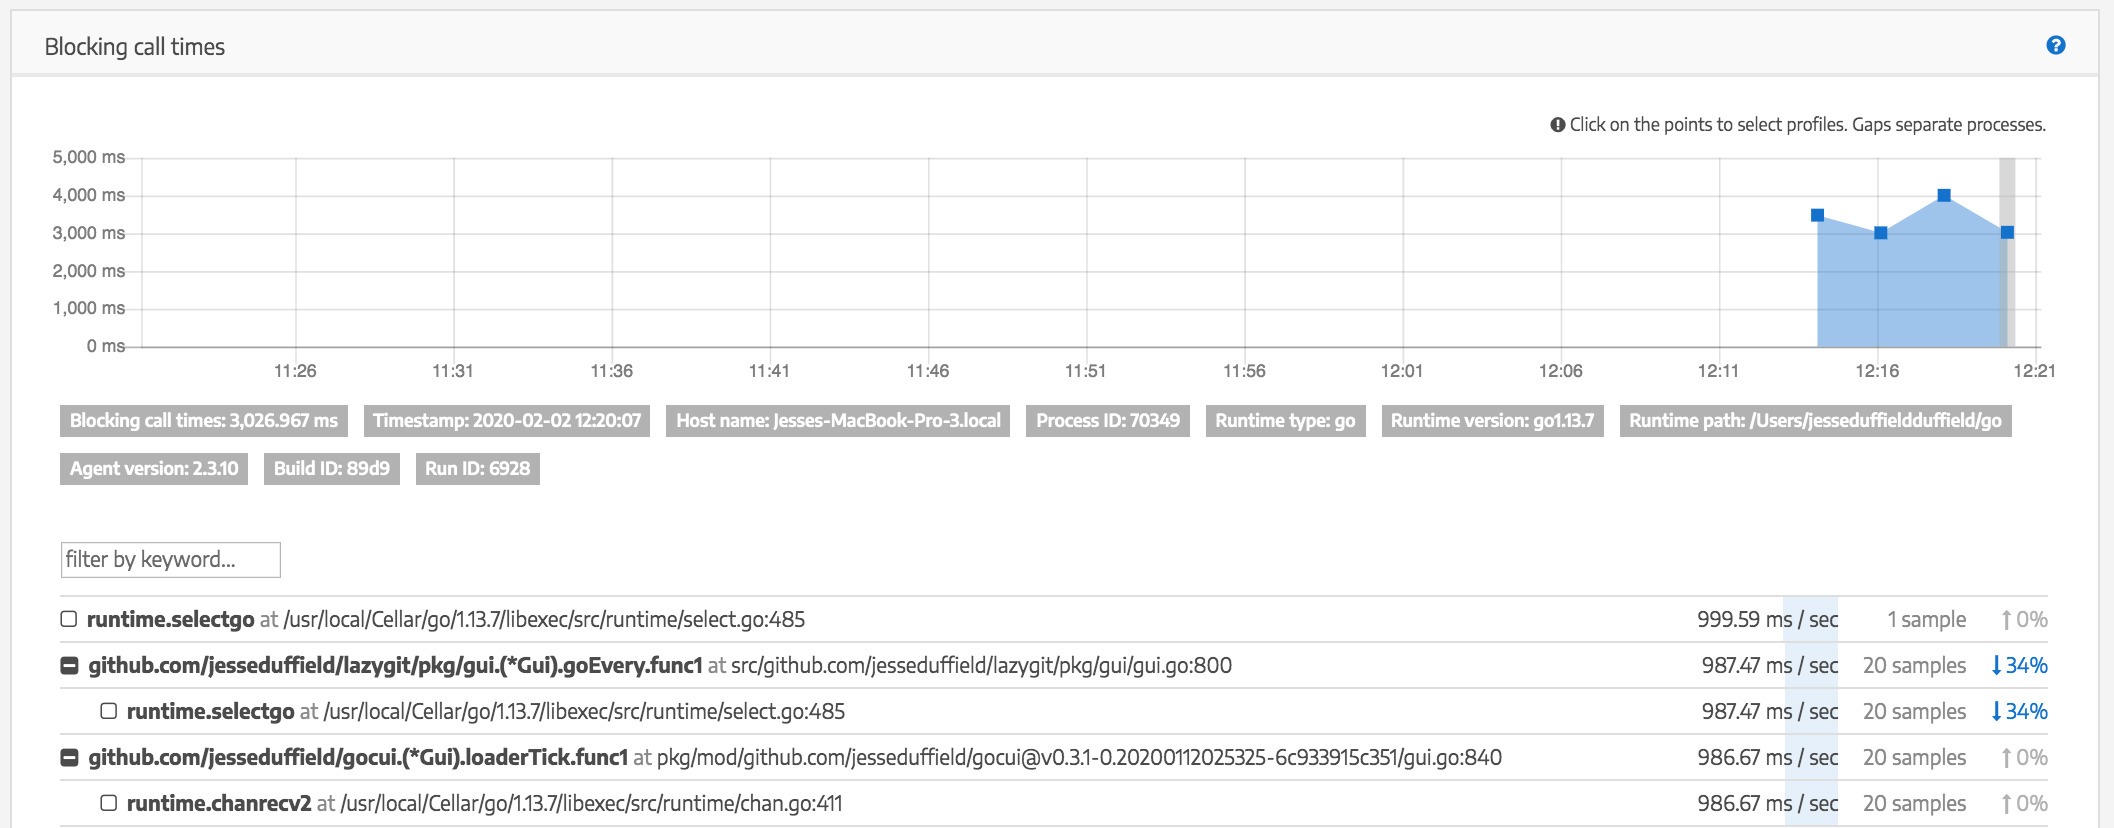
So I did some more searching and found another program: Stack Impact, which had support for monitoring blocking operations:
// in main.go

import	"github.com/stackimpact/stackimpact-go"

func main() {
	agent := stackimpact.Start(stackimpact.Options{
		AgentKey: "g8de...", // obtained after making an account
		AppName:  "MyGoApp",
	})

	span := agent.Profile();
	defer span.Stop();
	...

Viewing the Time tab, I could now see that there were two main culprits: the select of my goEvery function and my loaderTick function which was used for animating loader characters.
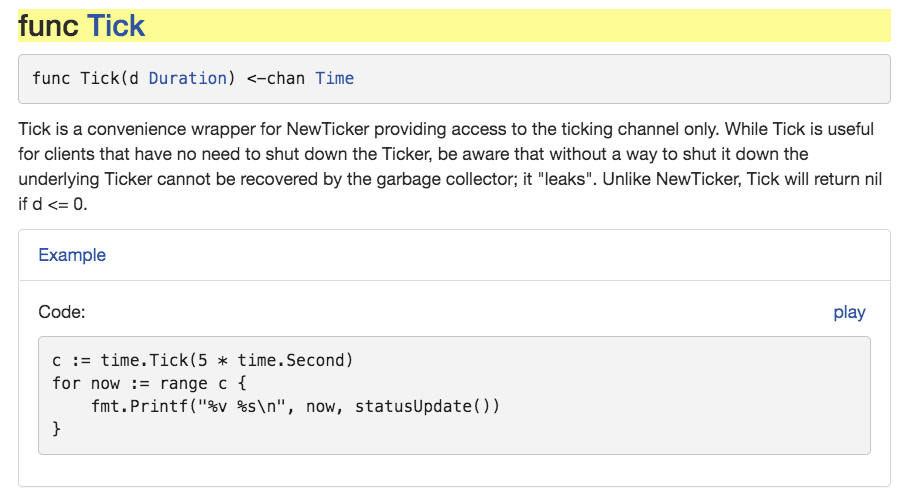
Now I just needed to find out what was so bad about them. I removed the inner function call from goEvery to verify that the cpu increase was literally just a result of waiting around in that select, and lo and behold it was. I looked up the docs for tickers and realised I had made a grave error:

I had never considered the fact that tickers might need to be manually stopped, or that they would tick forever. To make matters worse, I was actually initializing a new ticker on every iteration of the loop!
I made a quick experiment to verify this:
package main

import (
	"fmt"
	"time"
)

func main() {
	for {
		select {
		case <-time.Tick(time.Millisecond * 50):
			fmt.Println("tick")
		}
	}
}
Yep, within 20 seconds the CPU had climbed to 30%. With one small tweak I got it running at a constant <1% CPU:
package main

import (
	"fmt"
	"time"
)

func main() {
	ticker := time.NewTicker(time.Millisecond * 50)
	for {
		select {
		case <-ticker.C:
			fmt.Println("tick")
		}
	}
}
Now only one ticker was made. Plugging this into goEvery:
func (gui *Gui) goEvery(interval time.Duration, stop chan struct{}, function func() error) {
	go func() {
		ticker := time.NewTicker(interval)
		defer ticker.Stop()
		for {
			select {
			case <-ticker.C:
				_ = function()
			case <-stop:
				return
			}
		}
	}()
}
Cool. I also looked at the loaderTick function and applied the same change there (as well as changing the way animations worked in general so that we were only doing the animation when a loader was actually present in the gui). I then did an audit of all the places tickers were being used in the app and ensured I was both stopping them when they were no longer used, as well as only making a single ticker per loop.
All of a sudden, lazygit at rest is using a CPU of around 0.1%. Over a year of high CPU issues fixed in a single session of investigation, with some cool profiling tools. And a lesson well learnt: be careful with tickers! They cost CPU in blocking operations, and will run forever unless explicitly stopped.
Hopefully my adventure in profiling has given you some insight into how you might go about investigating performance issues in your own program! Thanks for reading.
Shameless plug (which appears on every blog post, not just this one, so don't think that I'm opportunistically posting this specific post just for the sake of doing this plug): I recently quit my job to co-found Subble, a web app that helps you manage your company's SaaS software licences. Your company is almost certainly wasting time and money on shadow IT and unused/overprovisioned licences and Subble can fix that. Check it out at subble.com